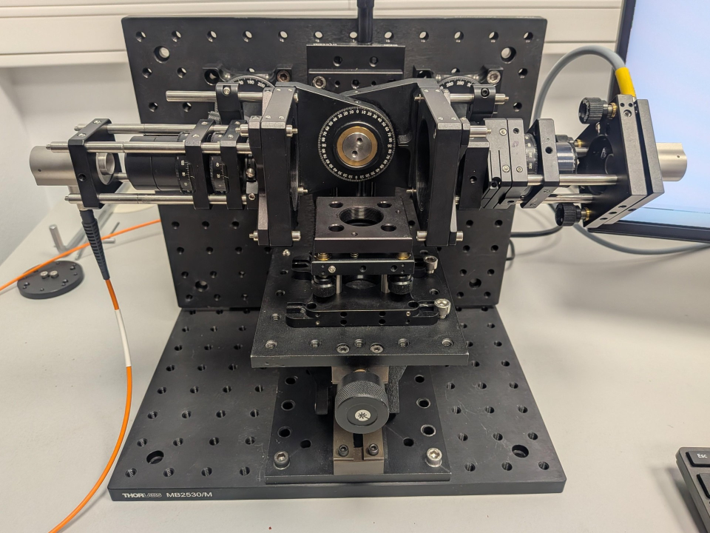
The snapshot generalized ellipsometer encodes polarization modulation in the wavelength domain rather than in the time domain, enabling instantaneous measurements. It can operate in both transmission and reflection modes, simultaneously measuring nine elements of the Mueller matrix spectroscopically. The system employs two high-order retarders—one in the polarization state generator (PSG) and another in the polarization state analyzer (PSA).
How does this differ from other Snapshot approaches?
Most other snapshot techniques operating in the wavelength domain rely on channeled spectropolarimetry, where the polarization information is encoded as a periodic modulation in the spectrum and retrieved via Fourier analysis. Our patented approach, in contrast, is based on a generalized ellipsometry framework that directly relates the spectrally encoded measurements to the Mueller matrix elements through a well-defined analytic algebraic model. We do this using the same highly stable inversion algorithms we perfected over years of work with photoelastic modulators. Furthermore, by using two high-order retarders—one in the PSG and one in the PSA—the system maintains high modulation efficiency across a broad spectral range, enabling the simultaneous retrieval of a larger set of polarization information in both transmission and reflection geometries.
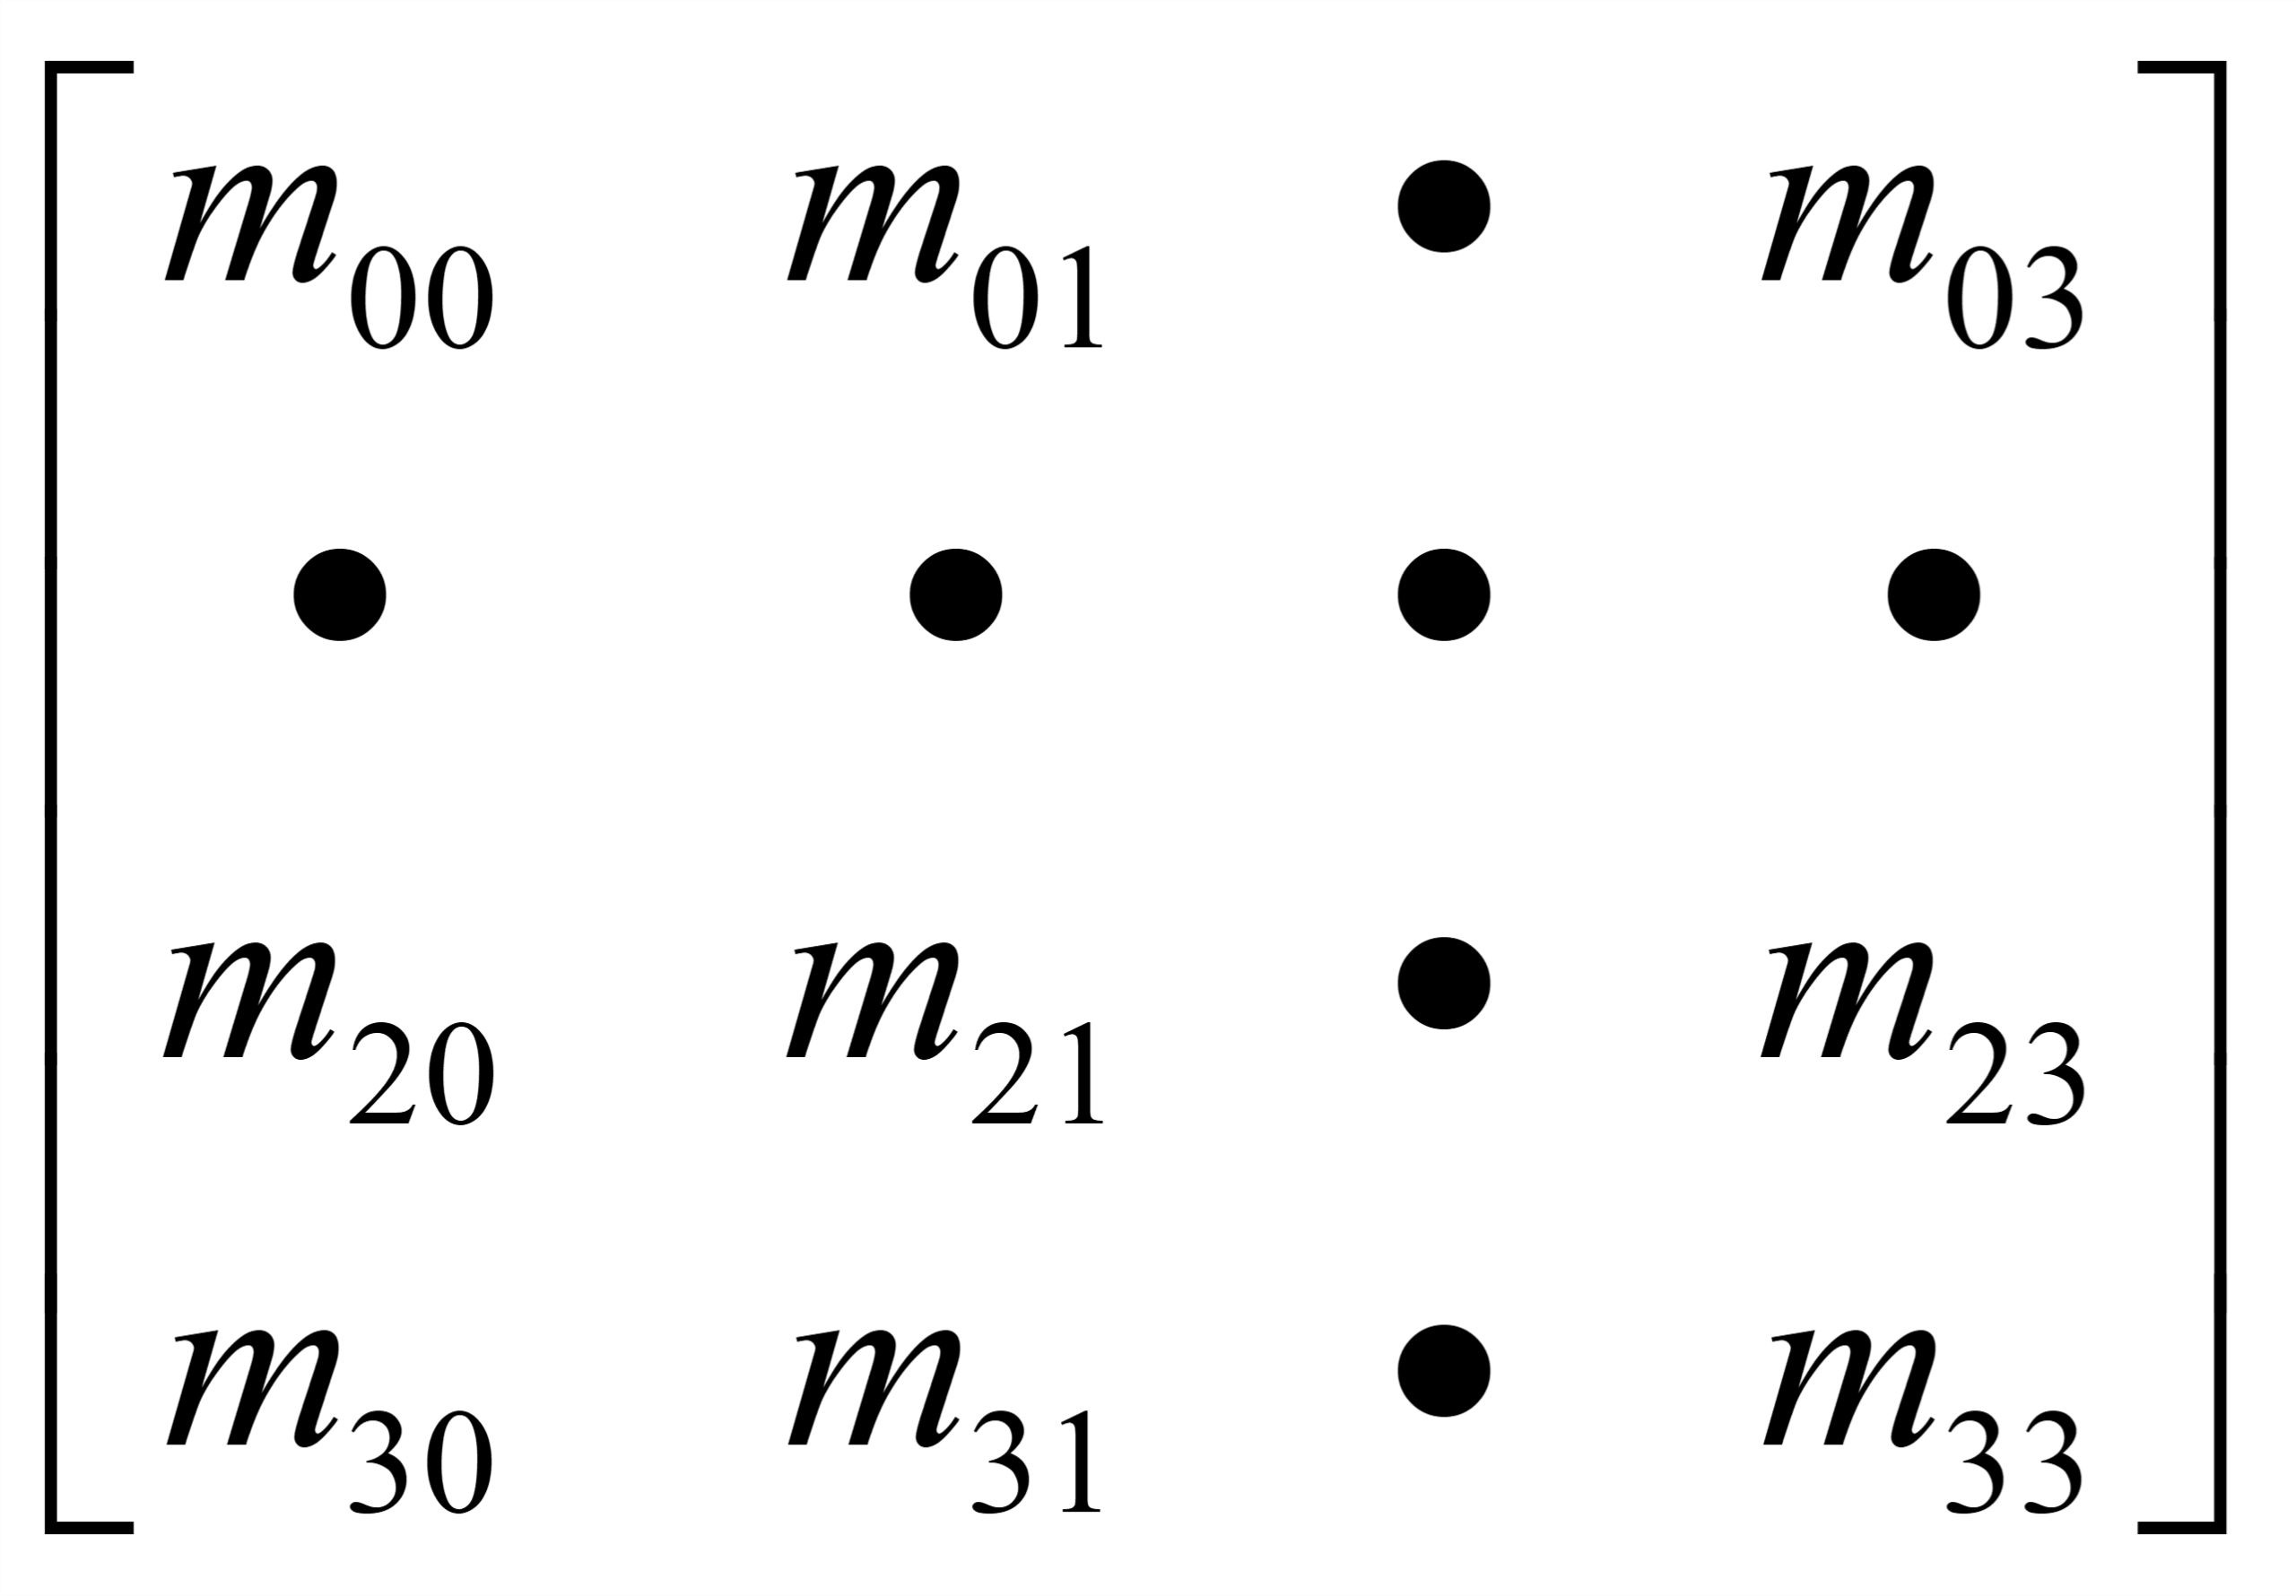
What Mueller matrix elements does it measure?
The following 9 elements can be measured simultaneously
How fast does it measure?
The measurement speed is limited only by the CCD/CMOS sensor’s exposure time and, to a lesser extent, by the data transfer rate between the spectrometer and the computer. In our system, measurements are routinely acquired every 10 ms, approximately 100 times faster than conventional time-sequential systems.
How well does it measure?
Since our method relies on spectral modulation, performance is directly linked to the system’s spectral resolution. Narrow spectral windows yield higher resolution but poorer numerical conditioning, while wider windows are more robust to noise yet unsuitable for samples with strong spectral features. Our prototype achieves a practical balance for ellipsometry, covering 400–850 nm with a spectral resolution of 20–40 nm.
With no moving parts, stochastic errors remain small and comparable to those of state-of-the-art time-sequential systems. Systematic errors are slightly larger due to the trade-offs in window selection and inversion. Calibration effectively suppresses systematic errors for samples with smooth spectral responses, but for samples with sharp spectral features, the finite spectrometer bandwidth introduces sample-dependent effects that cannot be fully compensated through pre-calibration.
The following comparison shows the systematic errors.
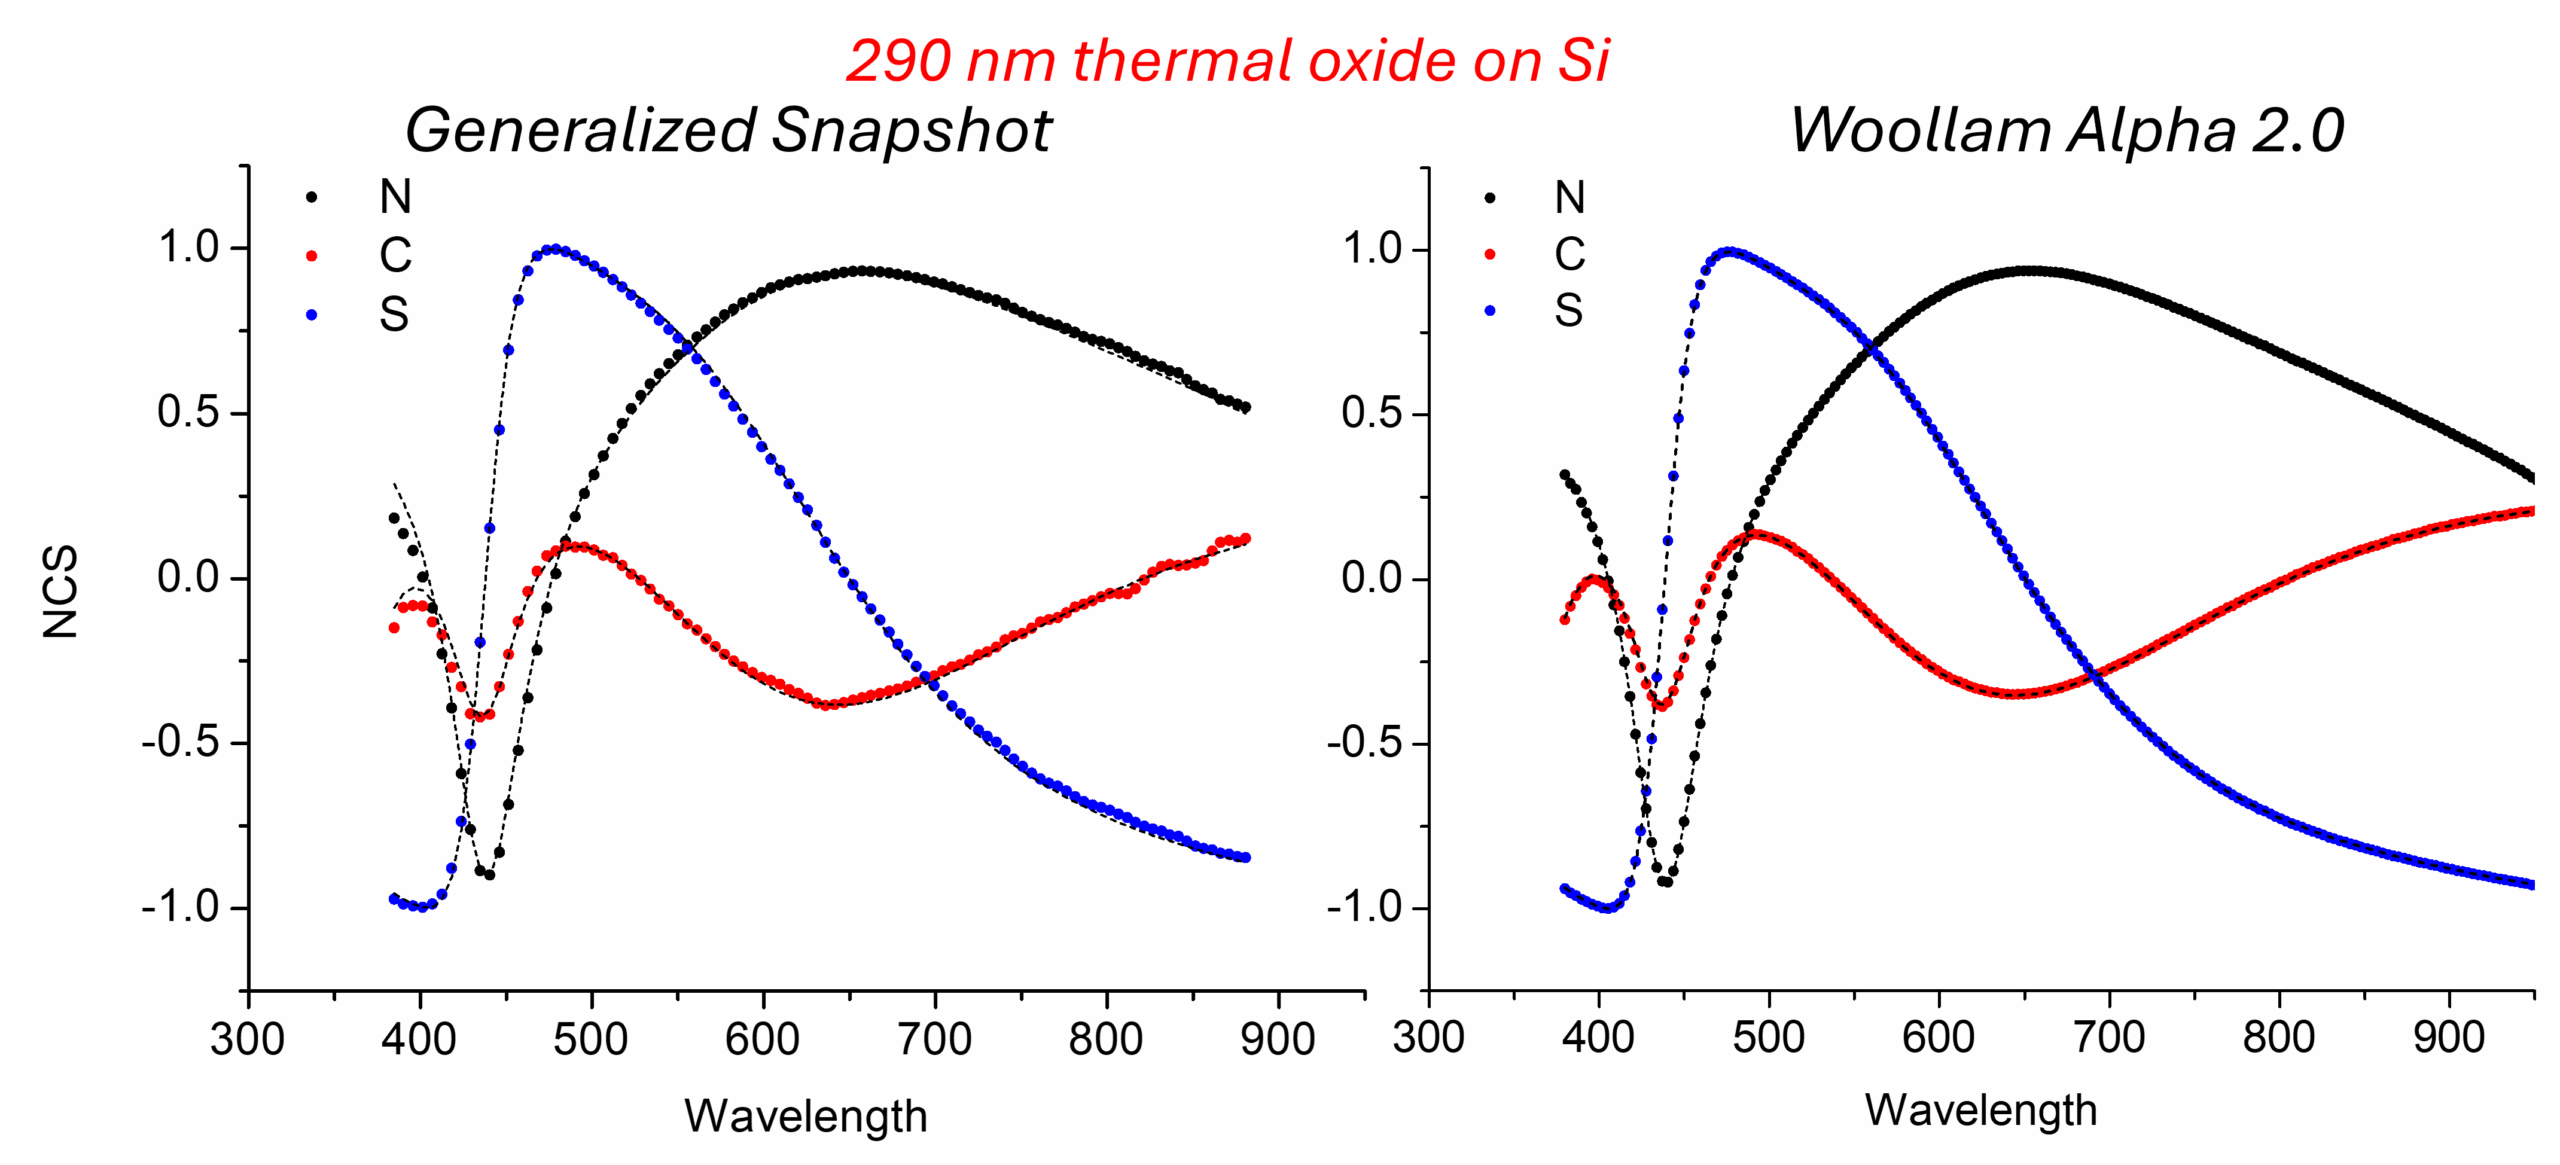
**Update December 2025**
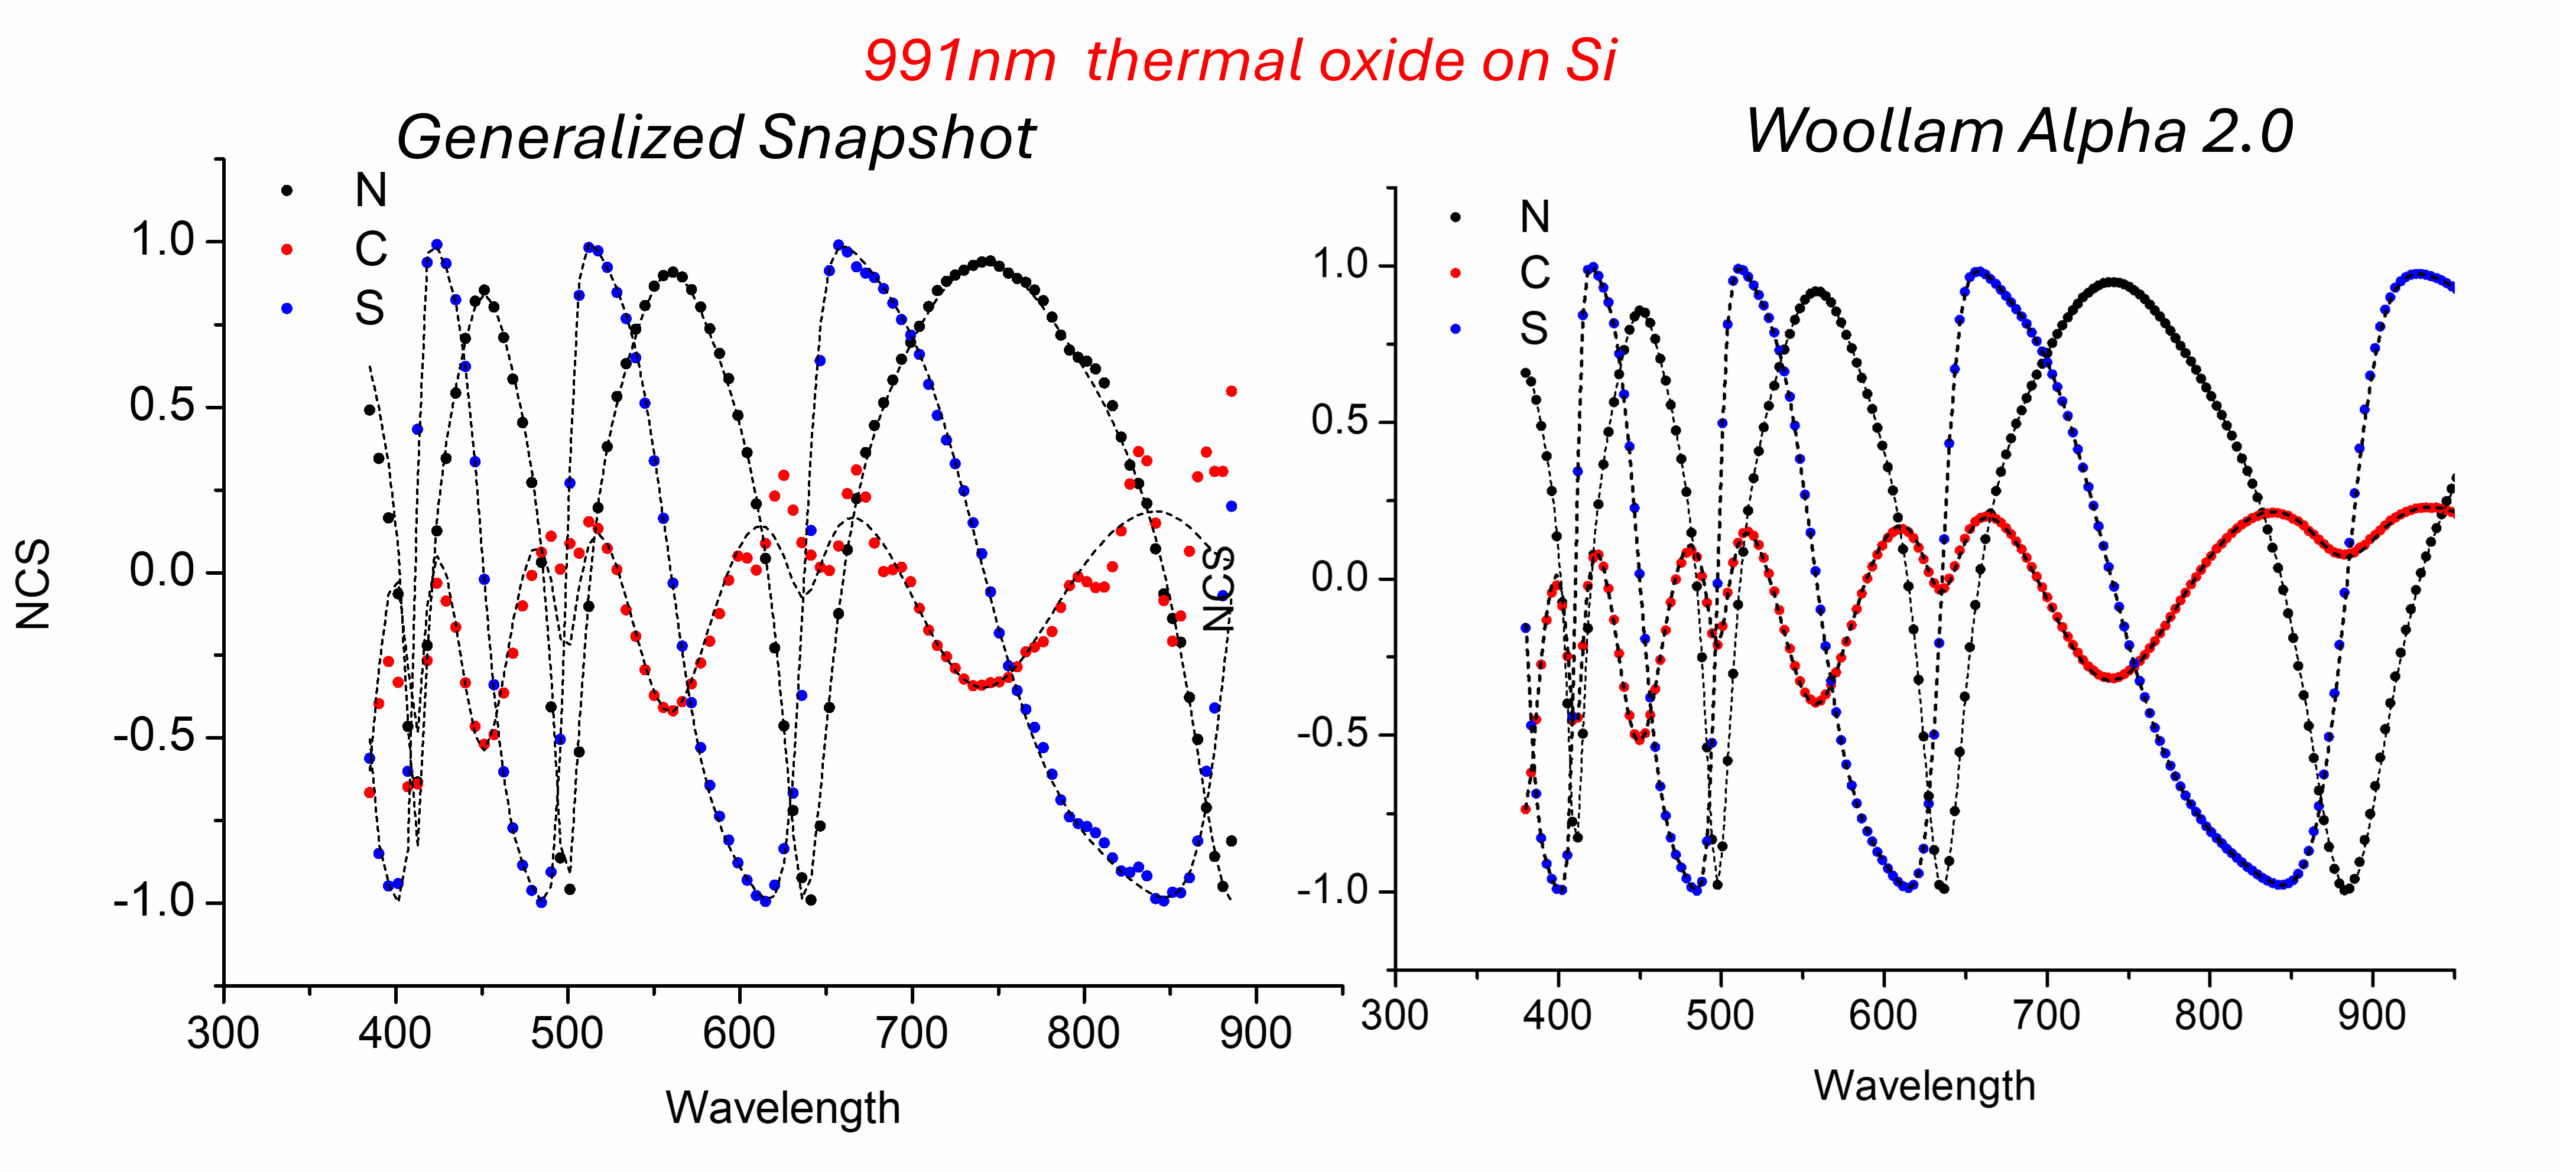
In the last month I have improved measurement quality. These are updated snapshot measurements with their fits (using Complete Ease software from our Woollam alpha ellipsometer).
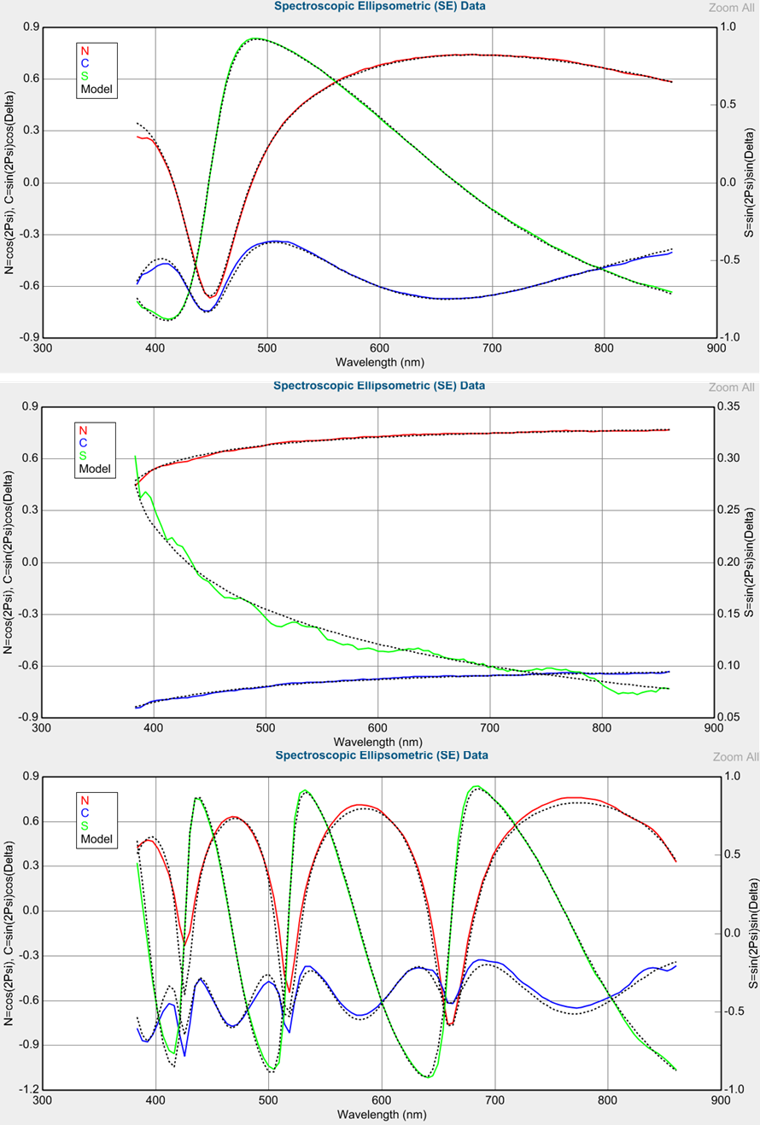
Which is the spectral resolution?
This is directly related to the previous question. The spectral resolution can be adjusted by changing the width of the spectral window. However, increasing the spectral resolution too much can degrade measurement quality. In practice, we typically operate the instrument with a spectral resolution of 20–40 nm (the actual value depends on the wavelength).
As shown in the image below, the finite spectral resolution means that some sharp spectral features are not fully resolved. Nevertheless, accurate thickness measurements remain possible, even for films that are not particularly thin.
Can it perform more challenging measurements?
Yes. In addition to routine thickness measurements, the system is capable of more demanding applications. For example, the images below show its performance with an anisotropic crystal (x‑cut TiO₂), which exhibits cross‑polarization effects that vary with the crystal’s azimuthal orientation. These signals will be very small.
In this image, 4 snapshot measurements on a TiO2 crystal (azimuth angles approximately at 0º, 90º, 45º and -45º). Crosspolarization appears only at 45º and -45º
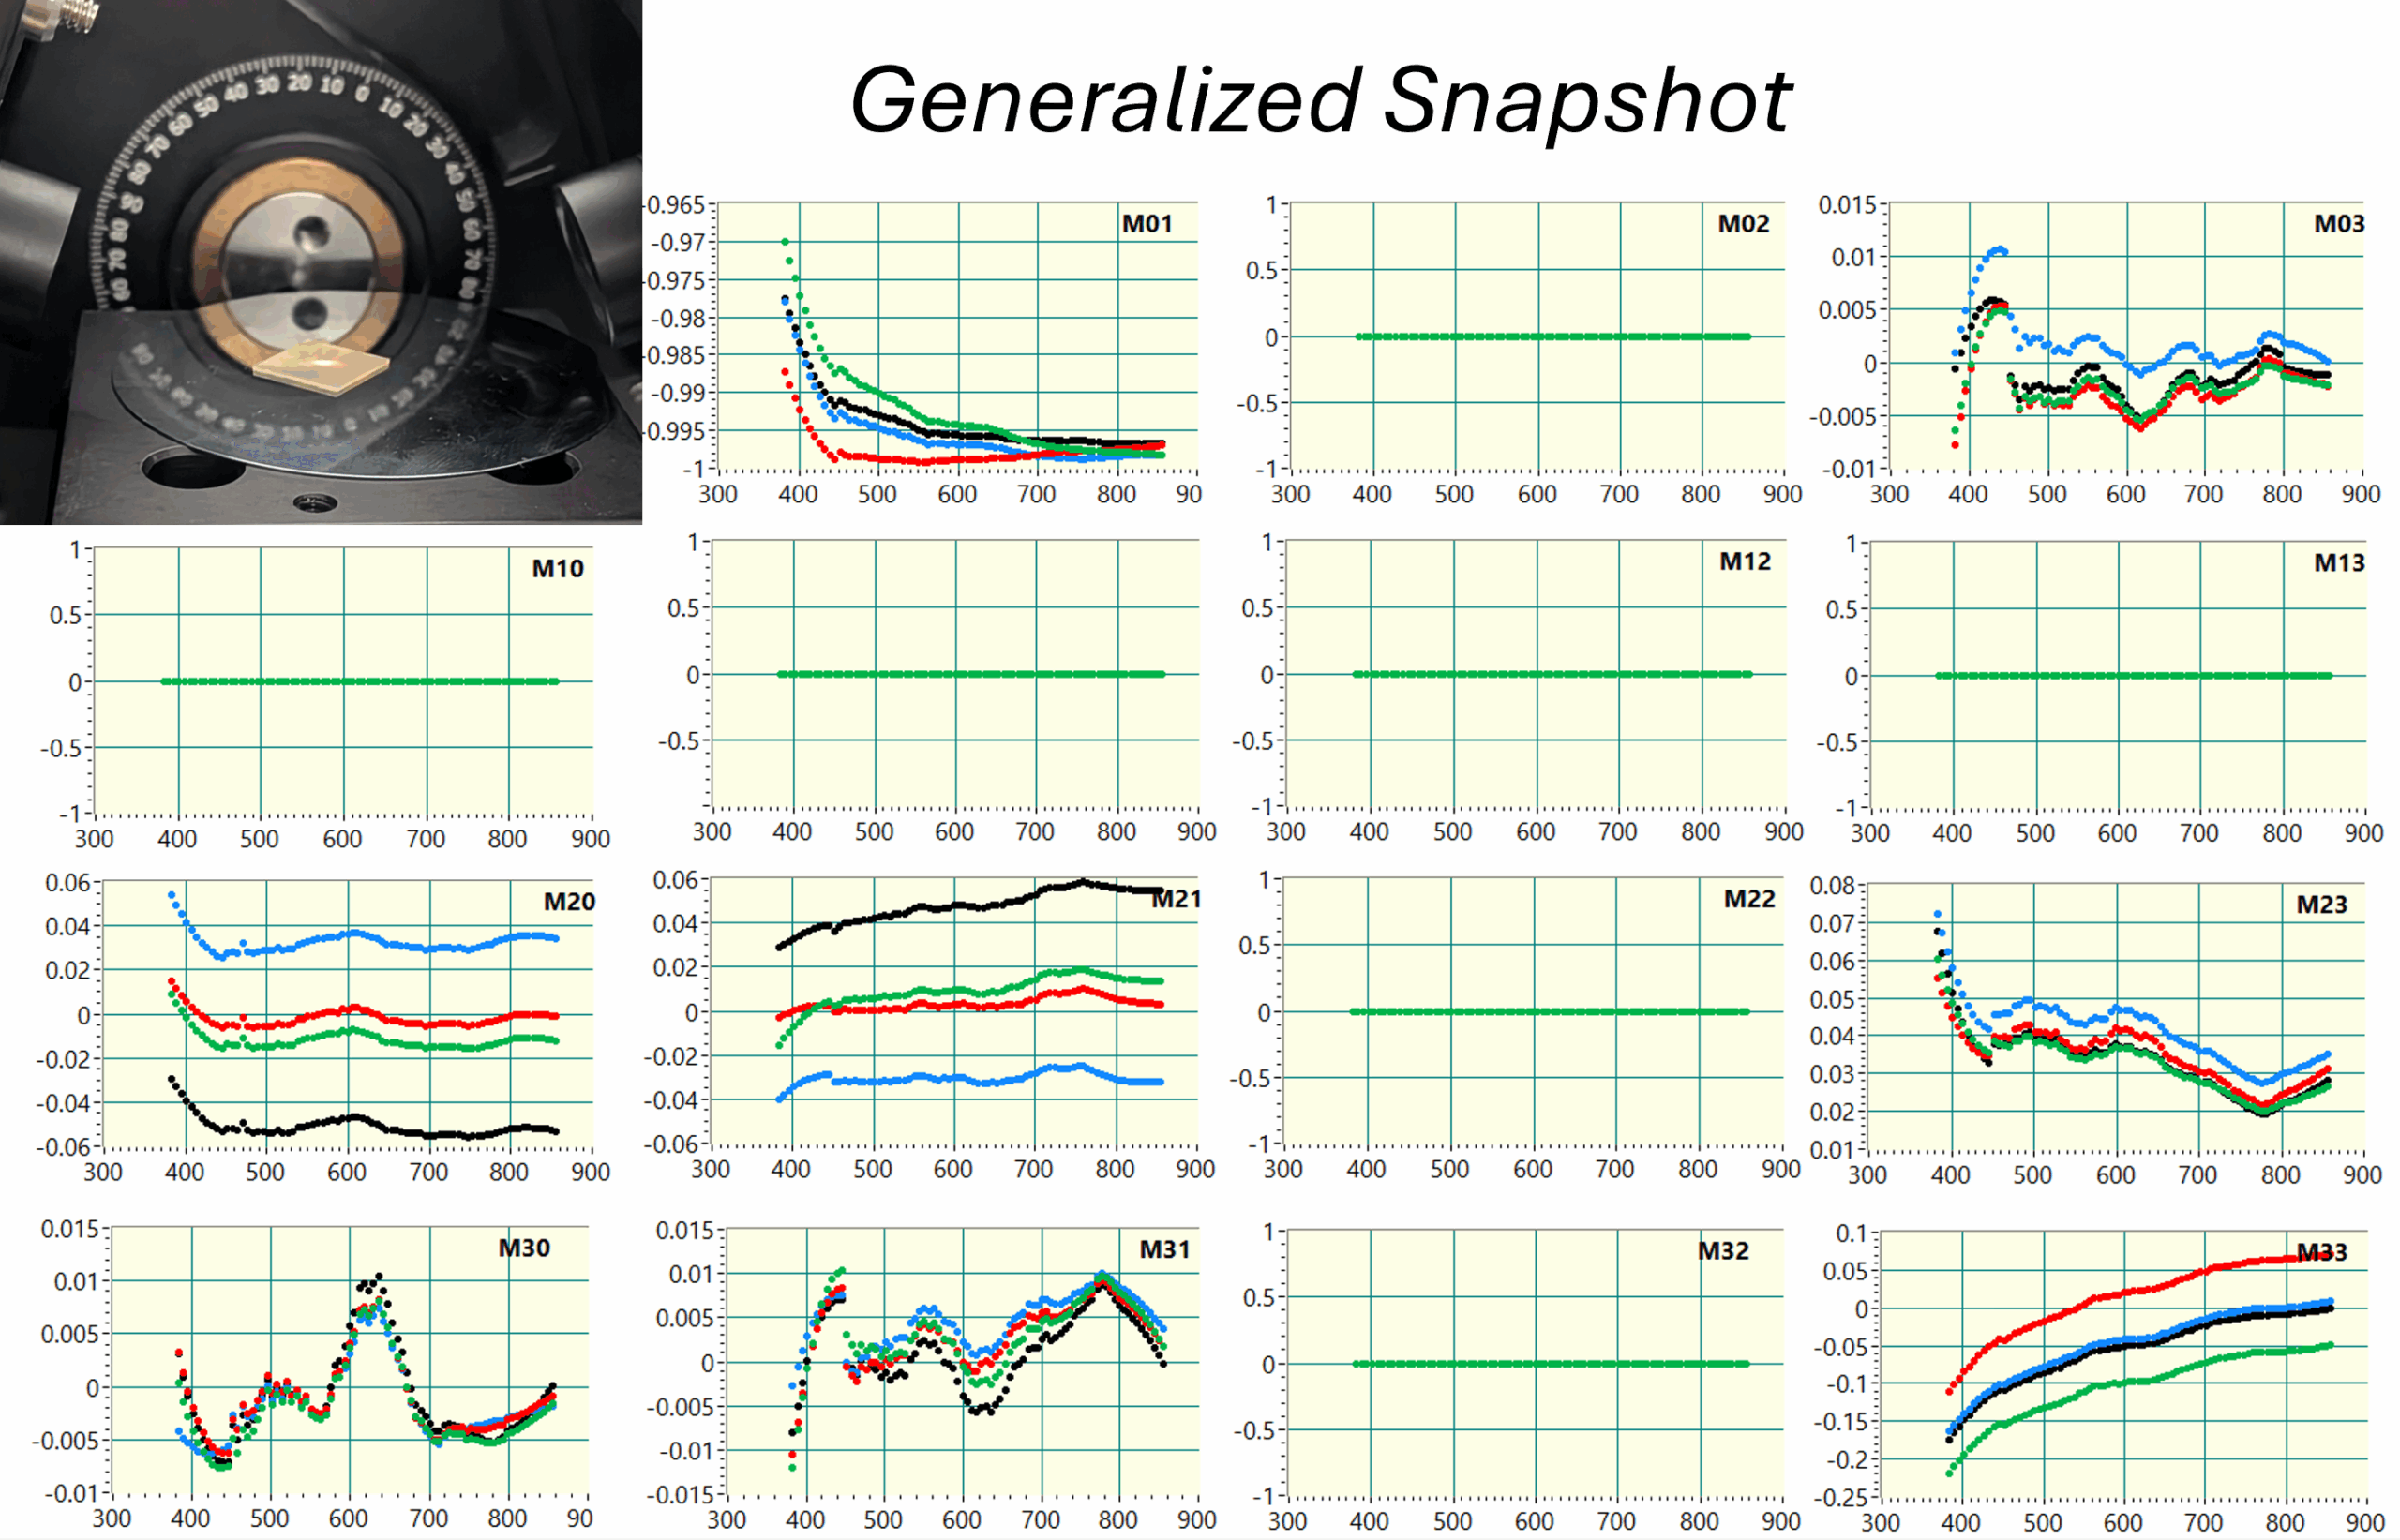
This is not updated, measurements now (Dec 2025) are better
Which is the spectral range?
The spectral range of our current prototype is around 400–850 nm. The technique can be extended to other wavelength ranges. The main limitation is the spectrometer, which must maintain sufficient spectral resolution across the range to resolve the high‑order oscillations introduced by the retarders. For example, using a dual‑spectrometer configuration with one grating optimized for UV detection (with a high number of lines/mm) would allow us to extend the range further into the ultraviolet and maintain the performance in the VIS/NIR.
Is it a low cost instrument?
It depends. Our current prototype can be considered a low‑cost instrument, as all components are reasonably priced and no high‑value parts are required. However, extending its capabilities, for example, by enabling UV measurements with a dual spectrometer or integrating mapping/imaging functionality, will increase the overall cost.
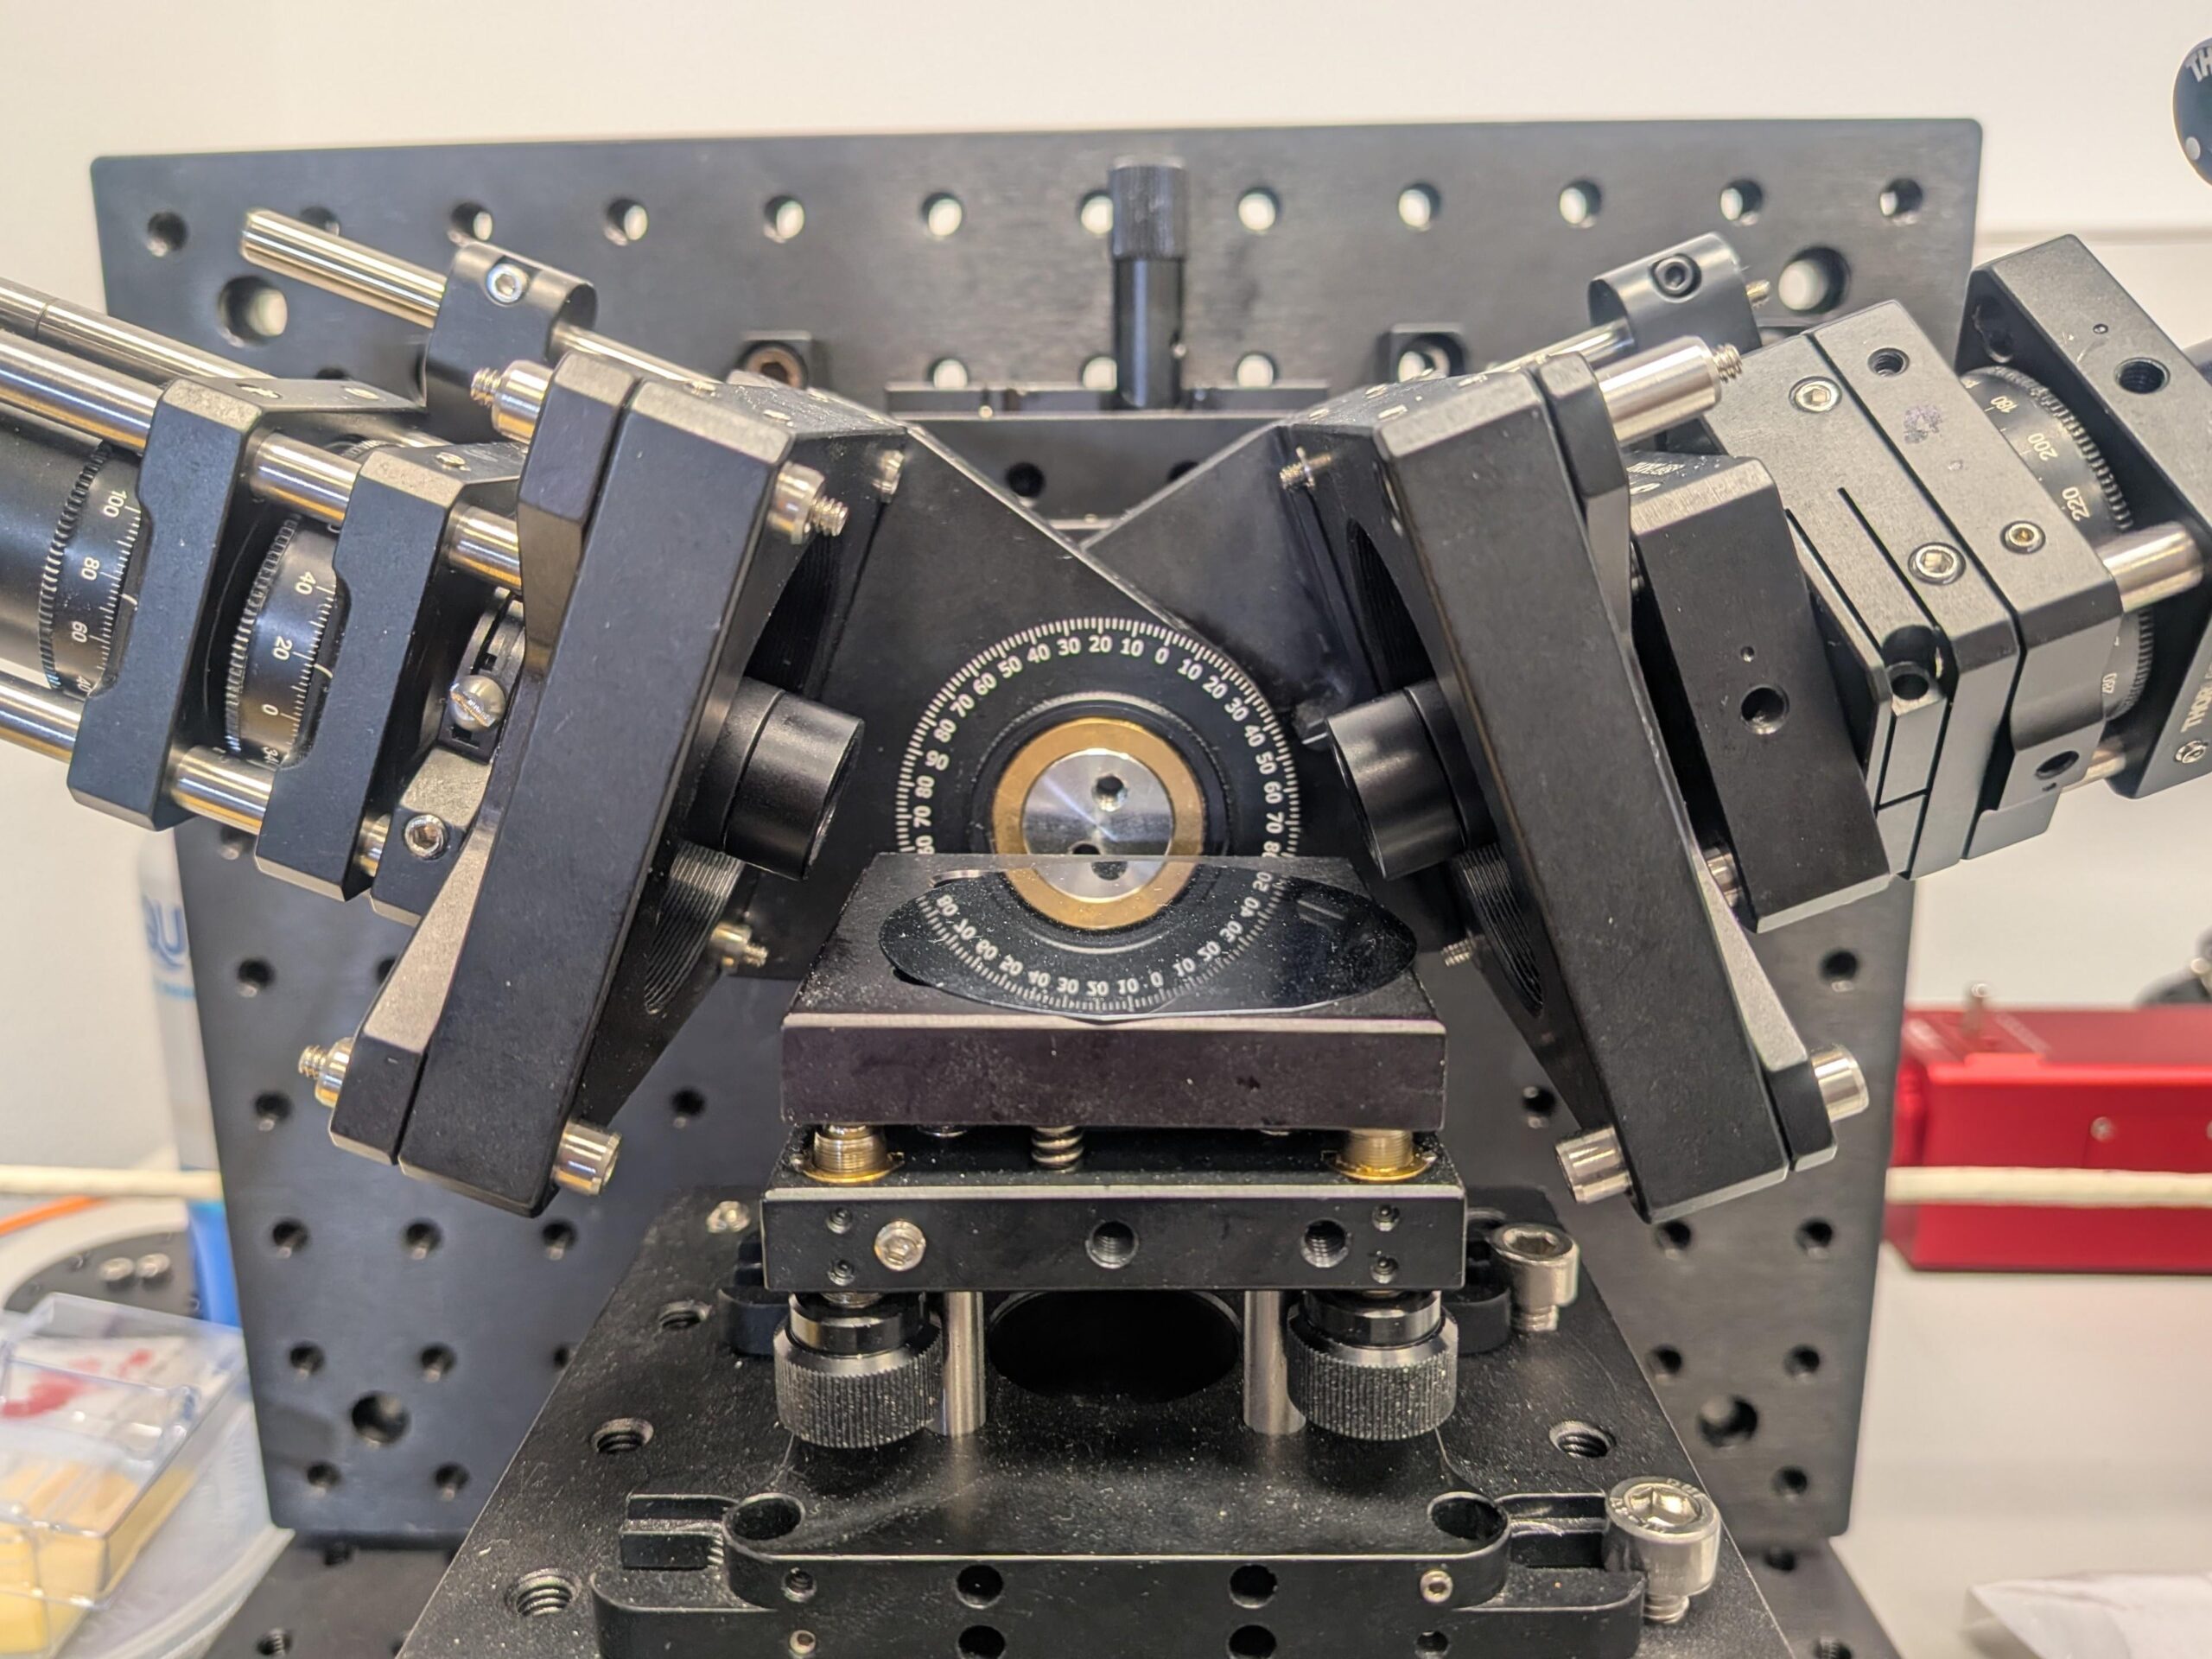
Can it use focusing probes?
Yes, we have tested the system with focusing probes to reduce the size of the spot. This is essential for mapping applications. The following photo shows the system with the probes installed. Measurement quality is preserved.
Which spectrometer uses?
Our prototype uses a very small Avantes AvaSpec-Mini4096CL-V10 spectrometer. The resolution is better than 0.5 nm.
Can it perform imaging/mapping ellipsometry?
Yes. We believe this could become one of the main applications of the system, although it has not yet been coupled to a fast motorized X‑Y stage. Thanks to the rapid acquisition speed of the ellipsometer, we estimate that 100×100 maps (10,000 spectral measurement points) could be recorded in about two minutes, enabling high‑resolution imaging in a very short time.
Can it measure depolarizing samples?
No. Measuring only 9 Mueller matrix elements is generally insufficient to fully characterize depolarizing samples. In addition, our spectral demodulation algorithm assumes that the sample is non‑depolarizing and assumes that any apparent depolarization observed is an artifact arising from the finite spectral bandwidth of the spectrometer when analyzing the high‑order retarder modulation.
Video Examples
Transmission measurements
Transmission measurements can be used to determine spectroscopically, the linear retardance, the circular retardance, the linear diattenuation and the circular diattenuation. This configuration is specially suitable to study retarders.
In this video a film polarizer is first measured, and then a quartz retarder is first measured
Reflection measurements
In this video the AOI was set to 70º and various silicon wafers with SiO2 overlayers are measured.
Measurements when shaking
This video demonstrates the excellent mechanical stability of the system. With no moving parts or components requiring power, the instrument maintains performance even when subjected to shaking.